Baba Yaga Night Terrors: Understanding Bomber UAS in Ukraine
Ukraine Bomber Campaign Modeling and Analysis
Baba Yaga Nightmares
In Eastern European folk tales, the “Baba Yaga” is a trickster-witch who prowls the skies under cover of darkness, sowing chaos and abducting unfortunate victims. Today, Ukrainian forces fly the modern Baba Yaga, the Russian nickname for a rotary-wing bomber unmanned aerial system (UAS) increasingly known for its night strikes on Russian targets. Ukraine manufactures several drones worthy of the moniker, including the Vampire drone shown below. As a tactical bomber, it aims to attack high-value targets, destroy defensive positions, and disrupt operations.
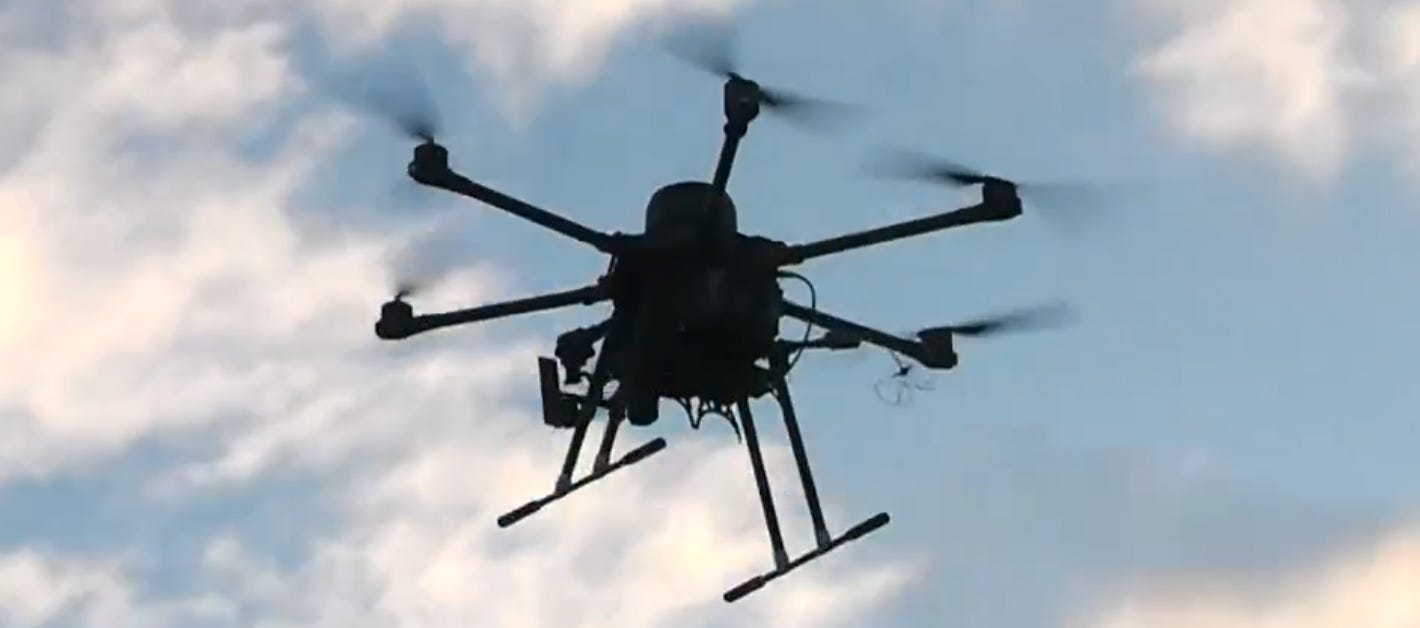
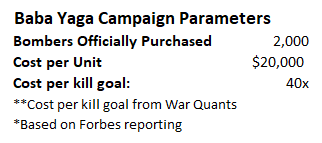
Ukraine is locked in an attritional battle with a numerically superior opponent. The Baba Yaga bombing campaign exemplifies the Ukrainian strategy to achieve asymmetric gains by attacking high-value targets with more attritable assets. In a war where cost matters, the Ukrainians have aimed to maximize their cost-exchange ratio, often targeting over 40x. Unlike many other attack drones, the Baba Yaga bomber is recoverable and designed to complete multiple missions. It is attritable on a unit cost basis, but the key to calculating its cost-exchange ratio is the expected number of missions it will survive.
To model and understand the potential scope and impact of Ukraine’s Baba Yaga bombing campaign, I leverage data from a recent Forbes article by David Hambling, itself based on inputs from OSINT analyst Andrew Perpetua. In the analysis that follows, I introduce a model to understand UAS bomber missions and conduct a cost-per-kill analysis to illustrate the value of unmanned bomber systems in modern combat.
What does a Baba Yaga Mission look like?
A general mission thread for a bomber UAS team could look like this:
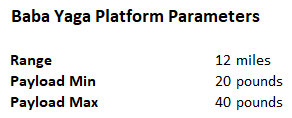
The UAS team moves from their daytime hide site to the nighttime launch point. The reported max range of the Baba Yaga is 12 miles, constraining the possible launch points for the given target sets.
The team launches the UAS once the system is calibrated and the team receives mission approval. According to Forbes, payloads range between 20 and 40 pounds.
The UAS flies from the launch point to the target. This flight may be a direct point-to-point or a circuitous route to avoid kinetic and non-kinetic anti-air assets.
The UAS identifies the target, hovers over it, and engages with gravity-dropped munitions.
The UAS returns to a recovery point, which may or may not be the original launch point. The UAS team could displace during the mission to make themselves less targetable.
The UAS team repeats the process until the missions are done for the evening and then returns to a day hide site for future mission planning.
Based on David Hambling's report, I have amplified and summarized critical parameters in the two tables below, adding detail to munition specifics, including expected casualty radius (ECR). The munition cost estimates are based on contract press releases and are necessarily coarse due to the lack of other reliable open-source information.

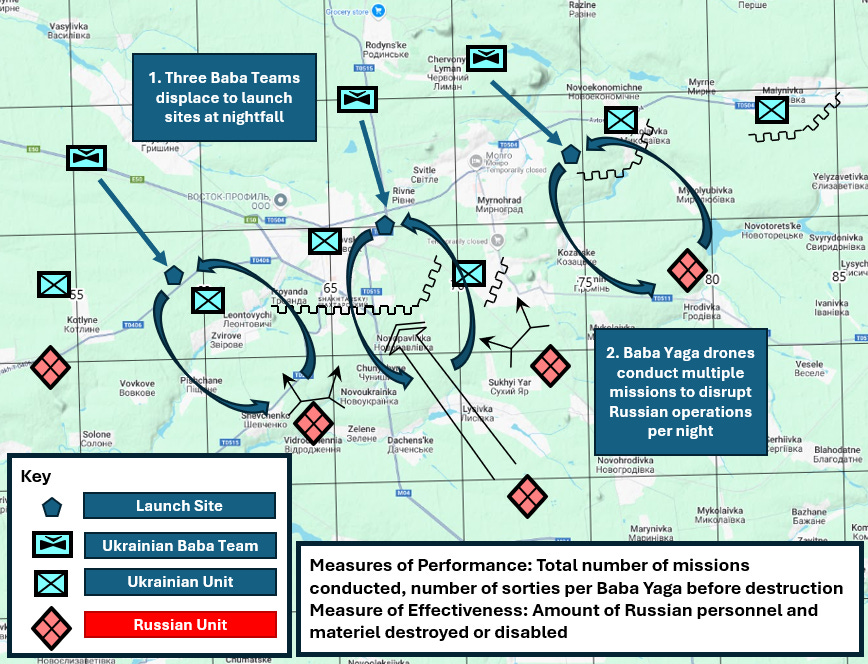
To begin developing the model, we should consider a notional scenario like the one shown in the map below. Here, I emplace three Baba Yaga teams operating around Pokrovsk, Ukraine, tasked with disrupting Russian attacks along the front.
The teams align their operations with the mission thread above and drop between 20 and 40 pounds of munitions per sortie, completing multiple sorties per night. We can also differentiate between measures of performance, and measures of effectiveness. Ukraine can calculate its campaign performance as the total number of missions conducted and the number of sorties achieved per Baba Yaga drone before destruction. Ukraine can also measure its bomber campaign effectiveness by the number of Russian personnel and the amount of materiel destroyed or disabled.
Modeling Individual Missions
Similar to the previous FPV attack drone models used by War Quants, a Baba Yaga mission can be broken down into parts. However, we need a slightly different model in this case, since the Baba Yaga is not a one-way attack capability. In an ideal case, the drone returns and is recovered by its operators for further sorties.
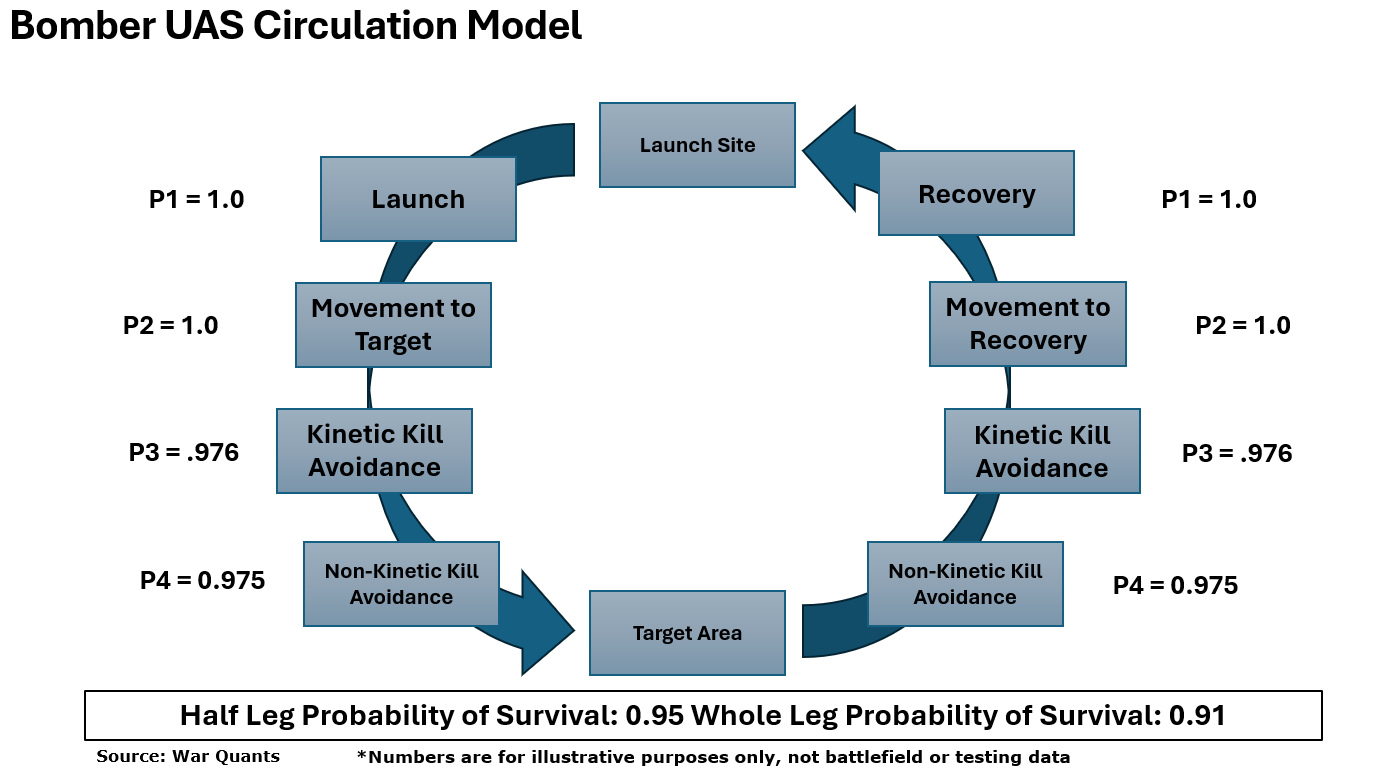
For this mission profile, I use a “Circulation Model.” Developed by CDR Jack Hall in 1969 and proselytized by Captain Wayne Hughes of Salvo Model fame, circulation models track an asset or assets through various stages of a mission and account for the probability that the asset is destroyed by defenses in each phase of the mission. The half leg probability is the likelihood that a bomber UAS makes it from the launch site to the target area, encompassing the probabilities of survival at each previous step. Likewise, the whole leg probability is the likelihood that the bomber UAS can make it from the launch site to the target area and back to the recovery site.
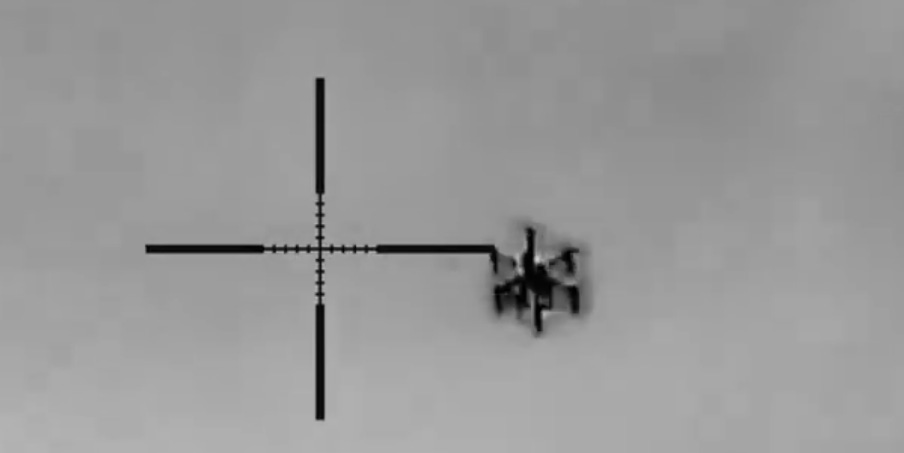
In this case, the probability of each step denotes the likelihood that the Baba Yaga bomber will survive that step. The model probabilities shown are illustrative. Kinetic kills include the possibility that the drone is shot down, has a net dropped on it, or is incapacitated with a hard kill, as shown in the video linked below, in which a designated marksman shoots down a Baba Yaga at night.
Non-kinetic kills include the possibility that the Baba Yaga is jammed, attacked with cyber capabilities, or disrupted by another soft kill methodology.
Based on the parameter values in this circulation model, the Baba Yaga bomber has a 95% half-leg survival rate. Thus, according to a geometric distribution, the expected number of successful missions before being shot down is 10. These values are illustrative, and battlefield data would be required to estimate the actual step-by-step probabilities accurately.
Scaling the Model to the Entire Campaign
From individual mission modeling, analysts can then begin analyzing the effect of these missions across an entire campaign.
The price per mission can be estimated by aggregating the unit cost per drone with ammunition costs, as shown in the table below. The more missions the Baba Yaga can conduct before it is destroyed, the lower its cost per mission because the unit cost is amortized over more sorties.
For illustration, suppose a Baba Yaga team uses 81mm mortars and, on average, achieves 20 sorties per UAS, equating to approximately 95% whole leg survival likelihood. Further assume that they hit and destroy the target 50% of the time. In this case, the cost per mission would be $3,400, and the price per successful mission would be $6,800. Using Russian military equipment cost estimates from RAND, the cost exchange ratio can be calculated as shown in the table below.

From a war materiel cost perspective, these cost exchange ratios are highly favorable to Ukraine and demonstrate the value of the UAS bomber program. For comparison, according to CSIS, an American Hellfire missile costs $85,000. Achieving a 40x multiple with a Hellfire missile would require finding a target with a unit cost of $3.4 million. Additionally, launching a Hellfire requires a large, often manned delivery platform, and the $3.4 million value does not capture that platform’s associated hourly operational cost.
Asymmetric Risk and the Unmanned Future
For Ukraine, the Baba Yaga bomber represents an opportunity to achieve asymmetric payoffs by placing low-cost, unmanned platforms at risk to achieve high multiple payoffs on invested capital. Because Ukraine is manpower constrained compared to Russia, it needs to continue a high payoff ratio campaign that attrites Russian strength while avoiding catastrophic risk.
Defense analysts will continue to assess the bomber campaign's effectiveness as more data becomes available. If successful, Ukraine will undoubtedly continue to develop and acquire more bomber-type UAS platforms.
Read More of Our Work Here:
One Million Suicide Drones with Chinese Characteristics
Carrier 2.0: The Drone Carrier Revolution
FPV Math: Precision Mass for 21st-Century Warfare
Capability Analysis: AI Machine Guns for Drone Short-Range Air Defense
The views and opinions expressed on War Quants are those of the authors and do not necessarily reflect the official policy or position of the United States Government, the Department of Defense, or any other agency or organization.



If you knew the disposition of the ground defence, you'd use these as the loci in a Voronoi diagram and you'd fly along the edges to the target, being the lines of furthest distance from the ground defence to maximise your survival chances. Great article again guys.